|
The Science of SexBasic Sex Differences (1)Basic Sex DistributionsExcerpts from Section 14 ofThe Tyranny of Ambiguity |
NORMALITY OR USUALITY? It is also fashionable to pose the question ‘What is normal anyway?’ Then we immediately have to make the distinction between what is normal and what is usual. It is often presumed that what is normal is what the majority do, but people may merely confuse what is normal with what they are used to. Clearly the potential exists, if it is not the actual case in the environment of this study, that abnormal behaviour can be the norm.
THE NORMAL DISTRIBUTION. The Normal Distribution is the most important statistical curve, illustrating many real-world features such as the distribution of height and intelligence in human populations. Standard deviation (σ) is the index of variability, or the ‘sharpness’ of the curve, and the centre, mean value is µ. Three basic distributions employing normal distribution curves are given to illustrate sex difference. The horizontal axis in each of these distributions is ‘degree the trait is expressed.’
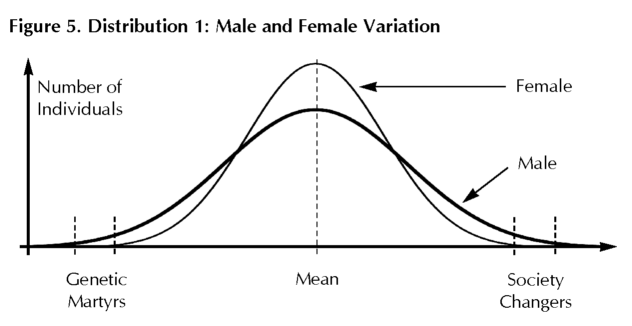
DISTRIBUTION 1. MALE AND FEMALE VARIATION. The first distribution illustrates characteristics for which the average value is the same for males and females, and are thus not sex-dependent. Characteristics which are known to follow this pattern include intelligence, eyesight and reading ability. The following figure is an idealized form of Figure 10 on p. 108 of Glenn Wilson’s The Great Sex Divide, which illustrates male and female IQ, but it should be noted that commonplace IQ tests are deliberately designed to give identical results for males and females.1

SOCIETY CHANGERS AND GENETIC MARTYRS. It is evident from Distribution 1 that variation takes place in human males to a greater degree than in females. This variation takes the form, at the extreme ends of the scale, of the exceptionally gifted or intelligent and, at the other end, the men whom I term genetic martyrs.
While many peoples’ stance is ‘Give me a job,’ ‘Tell me what to do’ or ‘Tell me which button to press and I’ll press it,’ society changers define the roles which others imitate. We owe to these individuals (who might alternatively be called meme creators or alpha-males) virtually everything: the invention or discovery of every modern amenity and the knowledge and understanding which allows us to progress. I propose that due to Distribution 1 and other factors there will, at best, be one woman for every 100 men in this category.
Genetic martyrs on the other hand are likely to be inadequate or dysfunctional in some way or other. I’m talking about weediness, short-sightedness and skinnyness, that type. I use the term martyrs because it is they who pay the cost, by chance alone, of the wider variation in males which allows geniuses and other high-achievers to come into being. This may be at the level of acceptance or rejection of a fertilized ovum in the womb; apparently around a third of pregnancies naturally and spontaneously abort because of an as yet poorly understood ‘quality factor.’ GM’s can be the most gentle and amiable, while others may have a chip on their shoulder. Many fall out of male breeding competition.

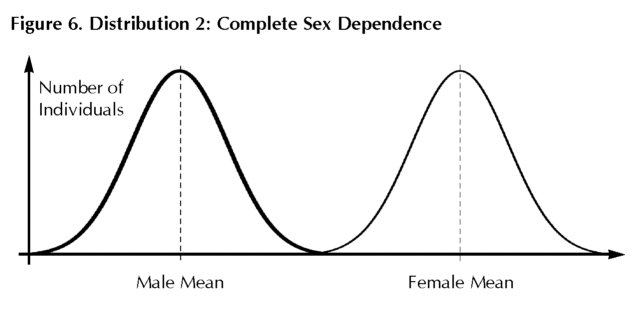
DISTRIBUTION 2. COMPLETE SEX DEPENDENCE. Distribution 2 consists of two Normal Distributions with no overlap and illustrates characteristics which are completely dependent on sex. One example of a characteristic following this distribution is the tactile sensitivity of a baby shortly after birth. Reportedly even the least sensitive female baby is still more sensitive to touch than the most sensitive male baby.

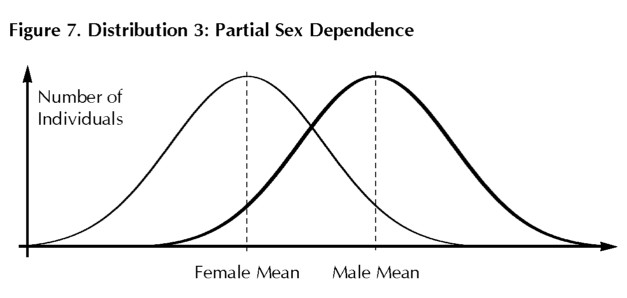
DISTRIBUTION 3. PARTIAL SEX DEPENDENCE. Distribution 3 consists of two Normal Distributions with overlap and illustrates characteristics which are partially sex-dependent. A good example of a characteristic following this distribution is height; the average for each sex is distinct but there are many cases where there is overlap. It is into this area that tall females and short males fall. Most characteristics probably follow this pattern; the set of characteristics which are expressed identically in both sexes seems relatively small.
Because of the considerable degree of overlap some females will express male characteristics. Males also exhibit female characteristics, but when they do it appears to be with greater variation (i.e. following Distribution 1). Examples quoted in this text of males strongly expressing female characteristics provide some telling contrasts to the norm. Turner’s Syndrome females provide an example of females who have no male hormonal influence at all, so that for certain characteristics there is little or no overlap with males.
FOOTNOTES
1. An explanation of the basis of IQ tests is appropriate. IQ is the ratio of Mental Age to Chronological Age MA/CA. Thus if a child of 10 performs as well as the average for a child of 8, the child has an IQ of 8/10 or 80%. This original method of testing IQ cannot be used for individuals older than 14 or 15.
2. Distribution 3 is similar to ‘Scores of men and women on masculinity-femininity sex attitudes inventory’ in Eysenck, The Inequality of Man p. 31.